HOW TO SETUP THE TEST
In the previous blog, we explained the problem with Cassandra cluster that we faced during performance tests and design changes that helped us to overcome the problem. Now it is time to present results!
Our final goal is to test the number of TPS for 3 DCs where each DC is in active mode. Each client demand from us at least 2 DC design with active-active mode due to importance of OpenProvider system. Three DC scenario is one step forward in terms of redundancy, better customer experience, and future expansion by introducing new services. Besides 3 DC scenario, we have to measure results for 2 DC (1 DC failure) and 1 DC case (2 DCs are out of function). Number of TPSs reached with 3 DC scenario have to be on the same level as 2 DC scenario. In other words, an outage of one DC should not affect the performance of the system. In the case when two DCs are down, the desired number of transactions is half of the max number of transactions.
Hardware footprint for each test:
- Policing Front node with resources:
- 32 vcpu
- 16GB RAM
- Cassandra DB node with resources:
- 24 vcpu
- 64GB RAM
- Traffic generator.
For each test, we have 3 DB nodes. As stated in the previous blog, policing node communicates with local Cassandra DB nodes i.e. there is no cross data center communication between policing nodes and Cassandra DB nodes. The replication factor for keyspace is 3 for each DC which means that each node contains all data.
We use Cassandra version 3.11.8 (the latest stable Cassandra version at that moment). JMV is configured to use 31 GB RAM with a G1GC garbage collector. The number of virtual nodes is 16 per DC node.
For each test scenario we defined the following flow of messages:

Authorization request

Accounting start if the response on authorization request was access accept a message

5 interim messages

Stop message
Why is this the most difficult scenario for the system? Each of these messages can be sent to a different DC. The system has to synchronize data from all DCs which are more than 150km far away one from another and be ready to process each message no matter where the request arrives. A few milliseconds after the system process accounting start message and insert a session in DB, interim message will arrive. OpenProvider has to verify that the session for subscriber exists, get the session data, and perform written logic. This test case is possible but with low probability. We know that it is the most difficult for the system so we can take it as the lower limit of system performance i.e. we can say that the system can process at least this number of TPSs.
Usually, an interim message will arrive after at least 15 minutes after the start message. For some clients, we have the interim message on each 2 hours. In this test case, after the system has processed 5 interim messages traffic generator will send a stop message. As we will see further in this blog, the complete flow will be finished in 50 milliseconds in the 3 DC case scenario.


Each test last 15 minutes. Test generator reaches max number of transactions in a few seconds so we can consider that system is under maximum load during all test period. We will consider 5 values as indicators of system performances:
- Incoming TPSs – Peak number of requests that traffic generator will send to OpenProvider due to burst nature of incoming traffic. All request are Radius request (authorization + accounting request)
- Outgoing TPSs – Peak number of radius requests that OpenProvider will process. It assumes Radius (authorization + accounting + accounting proxy requests) and LDAP requests
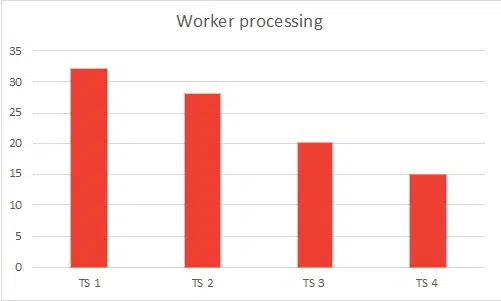
- Worker processing – number of Radius threads that process Radius or LDAP requests
- Avg auth request processing time (ms) – the average time that OpenProvider need to process authorization requests in milliseconds (QoS parameter)
- Avg acct request processing time (ms) – the average time that OpenProvider need to process accounting requests in milliseconds (QoS parameter)
WHAT IS THE RESULT OF TEST SCENARIOS
Test scenario 1 (TS 1): One Policing node in One DC
This is the worst-case scenario. It is assumed that only one policing node is up and running. Cluster has 3 nodes and each node is in the same DC. With 32 vcpu policing node can be configured to work with 64 radius threads (workers). These 64 radius threads are common for each test scenario. The system is not integrated with any external component (for example LDAP or any external DB system). It is assumed that AVPs that OpenProvider has received in the request is enough to perform all logic.
For this test case we have the following results:
Incoming TPSs | Outgoing TPSs | Worker processing | Avg auth request processing time (ms) | Avg acct request processing time (ms) |
~7000 | ~7000 | 32 | 2.5 | 4 |
Table 1: Test without accounting proxy
Incoming TPSs | Outgoing TPSs | Worker processing | Avg auth request processing time (ms) | Avg acct request processing time (ms) |
~7000 | ~14000 | 32 | 2.5 | 4 |
Table 2: Test with accounting proxy
So accounting proxy request does not affect performances of the system. After 7000 TPS average time for authorization and accounting process start to grow very fast and the system begin to drop incoming request. A number of workers on policing nodes is on maximal value of 64 and Cassandra increased read and mutation latency is the problem. So, in this test case, Cassandra cluster is bottleneck. We can conclude that one policing node in one DC can process 7000 incoming TPSs.
Test scenario 2 (TS 2): Two Policing nodes in One DC
This is a test case scenario when one DC is fully operative and another two DCs are out of function. It is assumed that both policing nodes are up and running. Cluster is the same as in the previous test case i.e. have 3 nodes, each node is in the same DC.
The system is not integrated with any external component (LDAP or any external DB system). It is assumed that AVPs that OpenProvider has received in the request is are enough to perform all logic. Also, it is assumed that the traffic generator will equally distribute incoming requests on both policing nodes.
For this test case we have the following results:
Incoming TPSs | Outgoing TPSs | Worker processing | Avg auth request processing time (ms) | Avg acct request processing time (ms) |
~7200 | ~7200 | 28 | 3.5 | 4.5 |
Table 3: Test without accounting proxy
Incoming TPSs | Outgoing TPSs | Worker processing | Avg auth request processing time (ms) | Avg acct request processing time (ms) |
~7200 | ~14400 | 28 | 3.5 | 4.5 |
Table 4: Test with accounting proxy
Accounting proxy request does not affect performances of the system. After 7200 TPS system starts to drop requests and the average time for authorization and accounting process starts to grow very fast. Number of the worker on policing nodes is max 64 and Cassandra cluster is bottleneck again. Comparing to the previous test scenario we can see that total number of TPS is slightly higher that one policing nodes scenario. The reason for that is that Cassandra DB is bottleneck in both cases. A number of worker processing is smaller in the second test case which is also expected because the total number of TPS is distributed on two policing nodes.
Test scenario 3 (TS 3): Four Policing nodes in two DCs
Test case scenario when only one DC is out of function. The number of TPS should be the same as all three DCs are up and running. It is assumed that four policing nodes are up and running. The cluster has 6 nodes in total, 3 nodes per DC. The system is not integrated with any external component (LDAP or any external DB system). It is assumed that AVPs that OpenProvider has received in the request is enough to perform all logic. Also, it is assumed that the traffic generator will equally distribute incoming requests on all four policing nodes.
For this test case we have the following results:
Peak Incoming TPSs | Peak Outgoing TPSs | Worker processing | Avg auth request processing time (ms) | Avg acct request processing time (ms) |
~10000 | ~10000 | 20 | 4 | 6 |
Table 5: Test without accounting proxy
Peak Incoming TPSs | Peak Outgoing TPSs | Worker processing | Avg auth request processing time (ms) | Avg acct request processing time (ms) |
~10000 | ~20000 | 20 | 4 | 6 |
Table 6: Test with accounting proxy
Accounting proxy request does not affect performances of system. After 10000 TPS system start to drop requests. Number of worker on policing nodes is max 64 and Cassandra cluster is bottle neck again. Cluster is distributed on two DC with 150km distance between two DCs. As stated in the beginning, replication factor is 3, each node contain all data so we have intensive inter-DC communication. Also, traffic generator send request in round-robin manner which mean that we have to guarantee data consistency between two DC and use cluster demanding write consistency.
Comparing to previous test scenario we can see that total number of TPS is 43% higher that two policing nodes scenario in one DC. A number of worker processing is smaller in this test case which is also expected because total number of TPS is distributed on four policing nodes. Also, the average time for processing of authorization and accounting request is a few milliseconds higher than in previous test cases which mean that Cassandra works very fast in a case when manage to process all request.
Test scenario 4 (TS 4): Six Policing nodes in three DCs
Test case scenario when all three DC are up and running. It is assumed that six policing nodes are up and running and the system works with full potential. The cluster has 9 nodes in total with 3 nodes in each DC. It is assumed that AVPs that OpenProvider has received in the request are enough to perform all logic. Also, it is assumed that the traffic generator will equally distribute incoming requests on all six policing nodes.
This is the real case scenario so here we have two test types:
- The system is not integrated with any external component (LDAP or any external DB system)
- The system is integrated with LDAP and has to send LDAP requests for each incoming authorization request. According to 3GPP standard and recommendation profile from LDAP server is cached for accounting request processing.
We will check the first results when the system is not integrated with LDAP.
Incoming TPSs | Outgoing TPSs | Worker processing | Avg auth request processing time (ms) | Avg acct request processing time (ms) |
~10500 | ~10500 | 15 | 4 | 6 |
Table 7: Test without accounting proxy
Incoming TPSs | Outgoing TPSs | Worker processing | Avg auth request processing time (ms) | Avg acct request processing time (ms) |
~10500 | 21000 | 15 | 4 | 6 |
Table 8: Test with accounting proxy
Accounting proxy request does not affect performances of the system. After 10500 TPS system starts to drop requests. The number of workers on policing nodes is max 64 and Cassandra cluster is here to the bottleneck. Cluster is distributed on three DC with 150km distance between each of them. As stated in the beginning, the replication factor is 3 and each node contains all data so we have intensive inter-DC communication. Also, the traffic generator sends the request in a round-robin manner which means that we have to guarantee data consistency between three DCs and use cluster demanding to write consistency.
Comparing to the previous test scenario we have only 500 TPS higher results that four policing nodes scenario in two DCs. The number of worker processing is smaller in this test case which is also expected because the total number of TPS is distributed on six policing nodes. The average time for processing of authorization and accounting requests is the same as in previous test cases.
Below are results when the system is integrated with LDAP:
Incoming TPSs | Outgoing TPSs | Worker processing | Avg auth request processing time (ms) | Avg acct request processing time (ms) |
~10500 | ~21500 | 15 | 13 | 7 |
Table 9: Test with accounting proxy and LDAP
We have 500 TPS higher value than no LDAP test scenario with the almost twice higher average auth time process due to network latency and LDAP requests processing time.
Comparation for different test scenarios:


Conclusion
So we can conclude that max number of TPS that the system can process for this test scenario and hardware footprint is around 21.5k TPSs. We saw that policing nodes, as stateless components, are on 50% of max performances for a huge number of TPSs if Cassandra is fast enough. In each test scenario, Cassandra was bottleneck. Simply, by adding new Cassandra nodes in each DC the number of TPSs is increasing. According to Datastax documentation, “Nodes added to a Cassandra cluster (all done online) increase the throughput of your database in a predictable, linear fashion for both read and write operations.” So, with the proper definition of partition keys, by adding new Cassandra nodes for the same replication factor of 3 data be will be distributed among more nodes and nodes will not contain 100% load. More nodes will handle read requests, mutation requests will not demand the participation of each DB node so we will gain more DB “power”.
In a production environment, it is expecting that average authorization and accounting request processing time will be higher two-three times due to higher data volume and much more Cassandra SSTables.
Hopefully, this blog will improve your skills so keep up to date with us as we bring more experiences and knowledge.


