Acquiring knowledge through experience might be the harder way to learn, but it is the only right one. We try, we fail, then try harder and even harder, until we start to make sense out of it, and an outline of the solution appears. Only then, we can begin to truly learn and acquire knowledge and new skills.
Acquired knowledge is invaluable. Its value multiplies on one condition – when shared with others. We believe that the following text will help the people in our industry save time and spare them from the difficulties they have not yet encountered.
With our experience and solutions to the problems, we believe that we can save someone weeks of trying to come up with a new resolution. The spread of knowledge must become a practice that will bring joint growth and progress in all spheres. So, let’s begin!

Test Setup
OpenProvider system dimensioning is based on the required number of Transactions Per Seconds (TPS). Under transaction we assume:
- Radius incoming request (authorization or accounting)
- Radius request for which OpenProvider system acts as a proxy server to the some another Radius server (mostly for accounting requests)
- Radius requests that OpenProvider initiate to NAS server (CoA PoD messages)
- LDAP request that OpenProvider initiate to external CNTDB system or our local CNTDB system
- Diameter incoming and outgoing requests.
Due to this, it is very important to test the performance of the system in detail, using a traffic generator. Test scenario should be as close as possible to the real traffic scenario and cover normal traffic intensity and significantly higher traffic that we have in a situation when some network component or NAS server fails. The system should be able to handle a higher amount of requests up to the required number of TPSs.
AAA system is categorized as a business-critical system so each Telecom wants a geo-redundant system. In a case of a failure of one data center (DC), another DC (one or more) should be able to handle all incoming requests without an outage. In our test case, three DCs are configured. When the system is fully in production, all three DCs should be active. So our goal is to have three DCs in an active mode. Theoretically, a client can send an access request to the first DC, accounting start to the second DC, and an accounting stop message to the third one. The database is the same so this scenario will be treated the same as when all three requests came to the same DC. From a testing performance point of view, it is necessary to test the number of TPS when all three DCs are active. Our goal was to reach N number of transactions. Also, when one DC has failed our goal was to reach N number of transactions. In other words, an outage of one DC should not affect the performance of the system. In the case when two DCs are down, the desired number of transactions is N/2.
Test setup assumes the following:
- 3 DCs
- 2 Policing Front nodes per DC with resources:
- 32 vcpu
- 16GB RAM
- 3 Cassandra DB nodes per DC with resources:
- 24 vcpu
- 64GB RAM
- Traffic generator.
Each policing node communicates with local Cassandra DB nodes ie there is no cross data center communication between policing nodes and Cassandra DB nodes. The replication factor for keyspace is 3 which means that each node contains all the data.
We used Cassandra version 3.11.8 (the latest stable Cassandra version in that moment). JMV was configured to use 31 GB RAM with a G1GC garbage collector. The number of virtual nodes was 16 per DC node.
Tables with Materialized Views
Generally, during the test, the system intensively uses 3 Cassandra tables (column families). The first table (will be named here as table_1) is without materialized view (MV) and only insert queries are performed by policing nodes with LOCAL_ONE consistency level. The table has defined time to live (TTL) for 7 days and is defined with TimeWindowCompactionStrategy. That table contains 5 columns and two columns are the primary keys. One column is partition key and that column has multiple rows within a defined TTL period (another parameter defined as clustering key is different so we do not have overwritten data).
The second table (will be named here as table_2) contain 3 MV. This is the main table of all systems, contain 26 columns and the partition key is a composite i.e. compound from two columns. The partition key is always unique for the main table. It is a combination of IP addresses of nodes that generate requests and session-id that nodes create. Session id should be unique ie it is a low probability that the node can repeat the same session id within a reasonable period of time. The first MV has 3 columns within a primary key. The first column, defined as the partition key, can have the same value ie there can be partitions with multiple rows (never more than 40 active). THE second MV has 3 columns within a primary key. The first column, defined as the partition key, has a unique value for the active row. The third MV has 2 columns within the primary key. The first column, defined as the partition key, has thousands of active rows but the total partition size is far below recommended maximal size. All views are defined as “SELECT * FROM main_table” which means that each MV contains all the 26 columns from the base table. On that table policing nodes performs select, insert, update and delete queries with LOCAL_QUORUM consistency level. Generally, these tables are used very intensively. It is defined with SizeTieredCompactionStrategy.
The third table (will be named here as table_3) contains also 3 MV and only insert queries are performed by policing nodes with LOCAL_ONE consistency level. This table contains 24 columns, has defined TTL for 7 days, and is defined with TimeWindowCompactionStrategy. One column is the partition key for the main table and the partition can have multiple rows within a defined TTL period. Also, each MV has one column as a partition key and the partition can have multiple rows within a defined TTL period. The total partition size is far below recommended maximal size for the base table and each MV. All views are defined as “SELECT * FROM main_table” which means that each MV contains all the 24 columns from the base table.
Data written in other tables within keyspace are cached for 5 minutes on policing nodes and after cache time expires will be loaded again. So, from a performance testing point of view, we can neglect that table and the impact that it can have on system performances.
MV impact on system performances
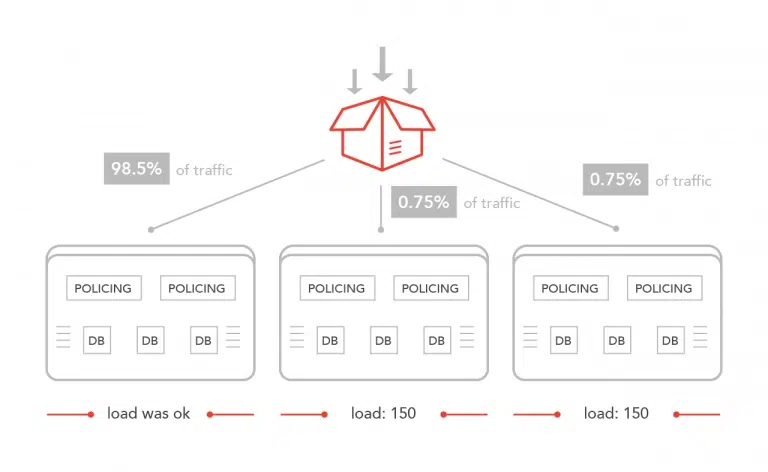
Before any serious testing, we wanted to do a short “warmup” in a way that the traffic generator will send a fifth of what the system needs to process to policing nodes in one DC. On another DCs traffic generator will send 10 to 15 requests per second. Cluster is established in all three DCs. Idea was to check that all the logic is set up correctly, every firewall rule is OK, NAS is added correctly, a shared secret is correct, routes are Ok in all the DCs… The short warmup was not successful. The system did not manage to process this load. We started to analyze the system behavior during the test and located the problem on DB nodes. Cassandra nodes did not manage to process this load. But the strangest thing during the analysis was that DB nodes on remote DCs ie DCs whose clients have very little traffic were overloaded. RAM memory on these nodes was used about 10% which is OK. We did not notice that the disk is a problem ie the disk was fast enough to process this load. RTT between DCs was on millisecond-level without major variation. But CPU was completely used by Cassandra users, the load increased from 1.5 to 150 in a minute and remote Cassandra nodes were useless. On a client side, we face the following exceptions (Cassandra PHP driver):
code:16777230, message: Request timed out
Command nodetool tcpstats showed us that all the mutation threads according to Cassandra.yaml file were in use. But still, hundreds of thousands of pending mutation was on mutation stage. System was started with DEBUG log level but there was no ERROR message. In the log file, we did not find that GC was started during that period. Also, we did not find that compaction was started on any of the important tables or MV. We have a lot of the following WARNING messages and nothing more:
AbstractLocalAwareExecutorService.java:169 – Uncaught exception on a thread
> Thread[MutationStage-341,5,main]: {}
DC which process the most of traffic had increased load but managed to process all the requests and DCs with a small number of the request were overloaded? We were confused. Ok, the replication factor is 3 which means that each node will contain all the data. Although, there is no sense that the node which accepts connections, performs a lot of select and mutation queries has a much lower load than the replication node which will perform the same amount of mutation but without selecting queries that generate a client. Log messages did not help us in problem analyzing.
Then we dive into Cassandra Jira’s reported issues, read tens of problems which relate to DB node overload, high load value, total CPU consumption, many problems with a mutation which other people had with Cassandra installation on multiple DCs, all thread with a warning message that stated before. We opened a ticket to DataStax support, provided all logs and system information. But logs were useless in this case and the DataStax support team was not able to help us.
After all the search, we decided to simplify the performance test in a way that the traffic generator will send only authorization requests. We started with the same number of TPSs as previously and the test passed successfully. Load on all Cassandra nodes was under 1. Finally one step forward, we were removed from the same spot. After that, we increased twice the number of TPS for authorization request only and the second test passed successfully. The third test was to generate the required number of TPS (stated as N) on all three DC. This test was also successful and the load on all the Cassandra nodes was under 2.
OK, let try the second test which assumes generating authorization and accounting start message. This test did not pass. It was clear that the problem is related to accounting message processing. We passed the code a few more times, make some changes in logic, same simplification. None of these changes solved our problem. Then we compared table_1 and table_2 and noticed that table_1 does not have a MV. The next step was to remove MV from table_2. We created the required lookup tables, adapt the code for lookup tables, created batch queries for each mutation, and repeated the test. Test passed successfully. The result was completely expected, DC with a lot of radius requests was the one with the highest load. Remote DCs had a three-time lower load. Great, the root cause of our problem is MV! After that, we removed MV from each table in our product, adapted the code for all the new lookup tables, and repeated the test. Test results were very good! We manage to reach the required number of transactions for all three DCs, two DCs, and one DC.
Conclusion
So from our experience, when you see the warning
“Materialized views are experimental and are not recommended for production use“
take it very seriously if you have a lot of mutation on the base table. It is much better to create a lookup table and perform mutation using batch queries rather than use MV. The MVs are known to create performance problems (I/O and CPU in particular), but the way a problem expressing was very specific and was not intuitive for debugging and analysis. It was not expected that remote DCs which handle small local traffic and all mutation from DC under heavy traffic will be under 15 times higher load than directly exposed DC nodes.
What about real performances that we achieved for different test scenarios? Find out in our next blog.


